P2CDS-622 Starter Project
This is an introductory project targeting the P2CDS-622 hardware and associated CODESYS Device package.
Tip
If you do not yet have a P2CDS-622 system and still want to learn the CODESYS IDE, there is an excellent tutorial referenced in WinPLC Starter Project.
Introduction
The P2CDS-622 Intro project will default to using the four(4) slot Base P2-04B unit. If your system has a different Base, this can be changed within your project.
This project will not be using IO Modules. Its purpose is to demonstrate using the CODESYS debugger on the P2CDS-622 hardware.
The programming language chosen for this project will be “Structured Text” and will be a very basic counter.
The main purpose for this project is to introduce you to the P2CDS-622 CODESYS related items like installing the Device package, etc. There are many resources available online that explain the IEC61131-3 programming languages and the CODESYS IDE tool usage.
A few are referenced in the Support section- CODESYS Support.
System Requirements and Installation
- This section requires the following:
P2CDS-622 CPU
P2000 Base (any variant)
P2000 Power Supply (any variant)
Latest version of CODESYS installed on Host PC
Ethernet port(s) configured per Ethernet section
Familiarity with the “Structured Text” programming language.
Recommendation for Data Protection
In order to minimize the risk of data security breaches, we recommend the following organizational and technical measures for the system that will run your applications:
Whenever possible, avoid exposing PLCs and controller networks to public networks and the Internet.
Use additional data link layers for protection, such as a VPN for remote access, and install firewall mechanisms.
Restrict access to authorized persons only, and change any default passwords and update regularly.
If you want to publish a web visualization, we strongly recommend utilizing HTTPS and assign simple password protection to prevent access to the functionality of your PLC over the Internet.
Help
Help is provided in the Help menu, as well as the context-sensitive <F1> key when in the IDE whether a project is open or not.
Currently, the web-based online help opens by default. This can be disabled in the CODESYS options so that the offline help (CHM format) is used.
Caution
In order to begin this project, the steps outlined in the Preparation section must be completed successfully.
Creating a Project
When creating a project, the main items that need to be done initially are to install the target device’s (P2CDS-622) Package and pick the language that the program file will use.
The project can be made up of many program/design PRG files. These are referred to as Programmable Object Units or POUs.
Start CODESYS and Create a Project
Start CODESYS
(1). Start CODESYS from the Start menu. By default, the path is Programs > CODESYS (version).
You can also click the CODESYS icon that is located on the desktop after installation.
Create a project
With the IDE open,
(2). Click File > New Project
The example project here will be named ExampleProj1
(3). In the New Project window, in the Templates section, select the Standard Project template.
(4). Specify a name and a storage location for the project and click OK
The project opens in the CODESYS Standard Project frame window.
(5). In the Device drop-down location, select the P2CDS622 device.
The next step will be to define the language for the initial program you will create. The default name for this program is PLC_PRG which we will rename later to “Main”.
(6). In the PLC_PRG in drop-down location, select Structured Text (ST). This will be the language used in the first program.
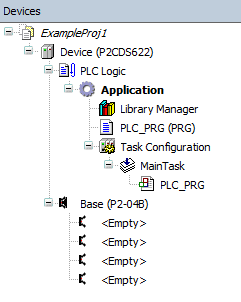
Your Project Tree view should look similar to the image below with the Name of your project and the associated Device (P2CDS622) as the target.
The default Base (P2-04B) is inserted in the tree with no modules added yet, i.e. <Empty>. If your hardware topology is a different Base, see the section below on changing the Base type.
The elements of the project tree can be investigated further by going to the Help section online by pressing <F1> in the device tree area and searching for a specific item of interest.
Caution
If Ethernet ports have not been configured yet, it is required that they be setup per the Ethernet section!
Rename Design File and add Fieldbuses
(7). Right Click on PLC_PRG (PRG) (not under MainTask) and in the drop-down select Properties. In the Common dialog box, rename PLC_PRG to Main. Click OK.
(8). A dialog box will prompt regarding the name change to be applied over the entire project. Click Yes.
Another dialog box entitled Refactoring will pop up displaying all the areas in the project where this new name will be applied. Click OK.
(9). If a Fieldbus (Modbus or EtherNet/IP) is to be used, it should be added at this point.
Add Fieldbus
(Not applicable for this project. Refer to the Ethernet section for more information if desired).
Change Base Type (if req’d)
If you are using a Base other than the P2-04B, you can change it now.
(10). In the device tree, highlight with a single click the Base (P2-04B) element, then Right-click. Select Plug Device.
The Plug Device dialogue box should appear.
(11). Under the Miscellaneous name, find the desired Base unit device and double-click. Close the box.
The Device Tree should now show the updated Base.
Write the Control Program
This simple program will be made up of two parts. One is a Function Block that will be the core counter function and the top-level code or the “Main” that calls the counter function.
Below is a view of the project with the Programmable Object Unit (POU) entitled Main.
(12). Double-click on Main to view the program file.
All POUs are comprised of two sections, the Declaration part that on the top defines the variables and their associated Data Types and the Implementation section where the code is entered.

Variables can be declared first and then referenced in the code. If the code is written first, the user will be prompted to declare the variables before the project will successfully compile.
This project will declare the variables first then reference them.
Create a Counter Function Block
Add an additional POU that will be a Function Block using Structured Text.
This function will be a counter that adds the value ‘2’ to the value contained in the input variable in and puts the result in the output variable called
out.
(13). In the device tree, select the Application object. Select the Project menu drop-down, click Add Object > POU. An Add POU pop-up will appear.
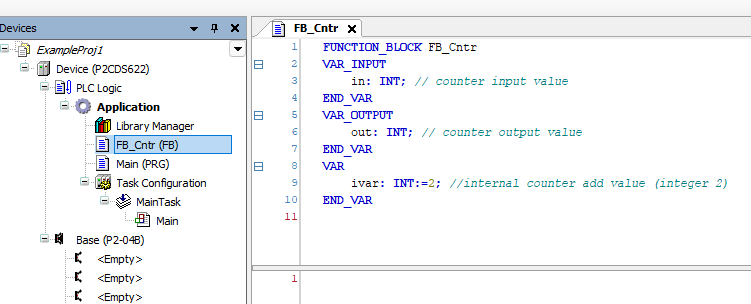
(14). In the Name area, type in the name “FB_Cntr” and for the Type of POU, select Function Block. For the Implementation language, select Structured Text. Click the Add button to confirm.
(15). Another editor window will open where the function FB_Cntr can be edited. Declare the following variables there. Comments may be added using the
“//” delimiter (as shown below).
Enter the Counter Function Block Code
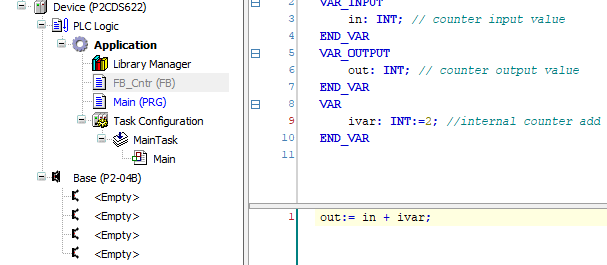
(16). In the Implementation for FB_Cntr, enter the following code that counts up by two (the declared value of internal variable ivar).
Type the Program Code into the Main Program
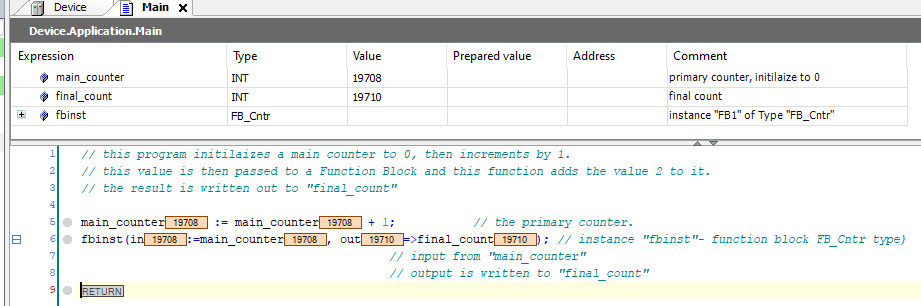
This main program will have a primary counter main_counter that increments by 1. This count then is fed into the function Block
FB_cntr that will take this count and add 2 to it. The result will be put in final_count.
(17). In the Main program, enter the following variables and code.

A View of the “Task”
Another very important area in the Device Tree is the Task Configuration section. This defines the way in which the program tasks are setup (which POUs are to run on a scan) and the characteristics of the task (priority, speed etc.).
The online help goes into more detail for this area, but for this project, the default values are acceptable.
Compile the Project
Next, we will compile and build the project to download to the P2CDS-622 target.
(18). Select from the drop-down menus- Build > Generate Code.
Connect to PLC and Download
The project needs to be downloaded to the target, but we must first connect to it.
(19). Physically connect the Host PC to one of the Ethernet ports on the P2CDS-622.
Configure Connection Channel to PLC
(20). In the Device Tree, Double-click on the Device(P2CDS622).
A Device tab should appear with the first tab on the left selected entitled Communication Settings selected. Now we need to scan the network to find our device.
(21). In the Communication Settings section, click on the Scan network.
A dialog box should pop up with all the CODESYS PLCs available to connect to on this network.
Note
If you are unsure which unit is the one you want to connect to, click on the Wink button on the right side of the select box. This should cause the P2CDS-622 front panel RUN light to flash for 5 seconds.
(22). Select the applicable P2CDS-622 unit and Click OK.
(23). Toggle the Run/Stop switch.
Now the following should be visible- both the Gateway and the P2CDS-622 have the green indicators present indicating the IDE is connected to the P2CDS-622.

Set the CPUs Real Time Clock
(24). In the Device Tree, Double-click on the Device(P2CDS622) if the Device tab is closed.
(25). Select the PLC Shell label. Type in the lower dialogue the following command and the current local time as rtc-set YYYY-MM-DDThh:mm:ss.
For example, March 4th, 2023 at 1:07pm and 44 seconds –> rtc-set 2023-03-04T13:07:44.
The Device connection will disconnect after this command, so reconnect again to the P2CDS-622.
To verify the time was set correctly, type rtc-get in the PLC Shell dialogue.
Download Application to PLC
(26). Click Online > Login.
A dialog opens up if there is an existing application on the PLC, if so Click Yes to continue.
Successful Download. Ready to Run
The system should show green highlighted Device and Application as shown below:
Verify that the Run/Stop switch is in the RUN position.
The  icon indicates connection is active (but program is not executing).

Run and Watch the Application
This section will walk through starting the application and using the debugger features, which allow a user to watch the variables in real time, set breakpoints and force variables to a specific value.
Start the Application
(27). Click Debug > Start.
The IDE should now be showing a green “Run” in the lower portion of the status area. Also, the Main Task should have a green Running icon next to it.
Watch the Application
There are several ways to monitor the variables of the application program and to influence them in the watch view:
Online views of individual POUs
Write and force variable values
Defined variable lists in separate watch lists
Online View of the POU
This view of the POU shows the current values of the watchable expressions in a table format located in the Declaration section, and if enabled, also in the implementation section in the form of “inline monitoring”.
(28). To open the online view, double-click Main in the Device Tree, or right-click Main and select click Edit Object from the context menu.
In the bottom part of the view, you see the lines of code as specified in offline mode. They are supplemented by the inline monitoring views after each variable which show the variable’s current value.
In the top section, a table shows the watchable expressions (variables with Type and current Value) of the POU.
Writing and Forcing Variables
You can write or force a Prepared Value in the PLC’s variable. The dialog is used to prepare or set a value that will be used when a force command of that value is initiated.
For example ivar, write or force the value of this variable to 777d (decimal),
(29). In the Prepared Value column in the top section of the applicable program for the variable of interest e.g. ivar,
select the field, press the spacebar to open an input field. Specify an integer value (777) and press the enter key
or click outside of the field to close the field.
(30). In the menu, click Debug > Write Values or Force Values. You see the corresponding result in the Value column
Tip
The Write Value command writes the value for one(1) cycle then releases it (can be overwritten). The Force command will hold the value until the Force is removed. See the associated Online Help for further details.
Using Watch Lists
Watch lists can be used to organize the expressions/variables from the application that you want view together. This can be useful for debugging purposes when specific variables need to be checked at a glance.
(31). In the menu, click View > Watch - Watch 1. The view opens.
(32). In the Expression column, click in the first row to open an input field. Specify the path for the variable to be
watched. We recommend that you use the Input Assistant for this by right-clicking in the blank expression field, and
selecting Input Assistant. For this example, select Device > Application > Main - main_counter. Press the enter key
to close the input field.
The data type of the variable is configured automatically in the row. Insert more rows for other variables if desired.
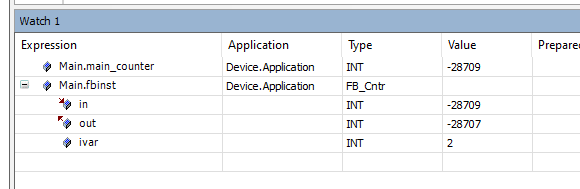
Any set of variables from all POUs of the project can be combined. Note in the case of instance
variables, such as for those of fbinst instances, it is sufficient to specify the expression as Main.fbinst.
The individual parameters are inserted automatically and the corresponding rows can be opened by means of the plus sign at the front of each row. The current value of each expression is displayed in the value column.
Debug the Application
One of the most powerful features of CODESYS is its debugging support capabilities. You can set multiple breakpoints and use various step-through the code commands.
Set Breakpoints
In Online/Login mode (not “Started” yet), you can define breakpoints where any program execution should be halted. When a breakpoint is reached, the program can be processed in steps. At each breakpoint and in each step, you can check the current value of the variables in the watch views.
(33). To demonstrate, in Main, set the cursor to line 6. In the menu, select Debug > Toggle Breakpoint to insert a Breakpoint where your cursor is.
The breakpoint is displayed in the program.
(34). Click Debug > Start to run the program.
The application will run to line 6 where the breakpoint is and halt. It will look like something like the following:

Stepping Through the Program
Now you can press <F8> repeatedly to execute the Step Into command in the Debug menu and run the program in single-step mode. This also steps into the function block instance.
(35). To skip the execution of a function block press <F10> to execute the Step Over command.
The current value of each variable is displayed at the processing position just reached.
Tip
The debugger can be single stepped also with the use of the Hot Keys that can be found in the following link: Hot Keys
(36). See also the Breakpoints dialog View > Breakpoints The currently defined breakpoints are listed here and can be edited or new ones can be added.
Note that the breakpoint positions are saved even when you log out of the PLC. The next time you log in, they will be displayed as light red markers and can be reactivated.
Execute Code Back to Beginning
(37). To restart debugging from the beginning of your program while still Online, select Online > Reset Warm.
This will take you to the beginning of the program in Stop mode and wait for you to initiate another Start.
CONGRATULATIONS! You just completed your first program on the P2CDS-622!